A tantalizing array of tools claim to help you with conversion optimization, including A/B testing. However, without enough traffic and conversions, you won’t get the results you want. Here’s an alternative approach that will get you headed in the right direction.
For anyone engaging in content marketing, your initial goal is always to increase traffic to your site.
Those traffic increases are kind of like a night of wild drinking. You’re caught up in the euphoria of seeing those numbers skyrocket, and you think your boss (or client) will love you forever. Then you wake up the next day with a whopping headache: lots of new traffic — no new customers.
No one is converting into a lead. Enter the hangover of today’s digital marketer.
Conversion optimization tools: Are they the answer?
So what to do? The next step is to figure out how to get that traffic to convert into leads. That requires improving your conversion optimization.
If you’re not familiar with the term, conversion optimization is the process of systematically testing the points on your website where you ask visitors to take action. It’s a discipline that has a wide range of practitioners, methodologies and tools.
Perhaps the most widely known methodology is A/B testing. Visitor A to a website will see one headline on a webpage, for example, and visitor B will see another. Each page will include identical calls to action.
In the end, A/B testing results will show you which headline is the most effective.
It’s that “in the end” part where things can get tricky, especially for websites with a lower amount of traffic, and more importantly, conversions.
Is the lift statistically significant?
Convert.com’s Dennis van der Heijden explains that A/B testing isn’t for everyone. He found a correlation between successful A/B testing and websites that have more than 400,000 unique visitors per month.
Quantitatively, these sites have enough visitors to produce statistically significant results for an A/B test. But also, qualitatively, they have the experts to create the right test in the first place.

Convert.com’s Dennis van der Heijden
“When you get to a website that big, there’s always a great team behind it,” he said. It’s generally a team with conversion optimization specialists, designers, writers and SEO strategists. Lots of people, lots of resources.
Does that mean you can’t conduct A/B testing without 400K unique visitors per month and a kick-butt staff? No. But the likelihood of your test succeeding won’t be as great, according to Dennis.
As for conversions, Joel Harvey of Conversion Sciences notes that a particular page should have 300 to 400 conversions per month for A/B testing to even be considered. “In fact, even if your site gets 500,000 visitors but no conversions, you shouldn’t be doing A/B testing at all,” he said.
The reason is simple. If no one is biting on either headline, then you’ve obviously got a problem bigger than your headline.
So what can you do to boost conversion optimization?
Now it’s important to note that Dennis van der Heijden isn’t saying all optimization tactics should be ignored, but it can be an undertaking if you don’t have the expertise to deliver.
“You’re better off focusing on other areas, such as increasing traffic through SEO, paid search or remarketing,” he said.

Agreed. But remember that marketing hangover? When you wake up with all that traffic and no conversions?
At some point, you will need to look at improving your website and its conversion rate. And for that, you should consider serial testing.
Serial testing: Looking for a lift of 25-30% or higher
We developed our serial testing methodology based on conversations with smaller marketing departments, in our quest to find a methodology that works for them — one that might avoid the pitfalls of A/B testing, yet help you achieve your ultimate goals.
In essence, serial testing is qualitative. It’s a series of tests designed to generate a lift of 25-30% or more, which means you don’t need as large a sample size for it to be statistically valid and provide a high confidence level.
Dennis explains the confidence level of a test: “The higher the confidence (you want a 95-99% confidence level to be reached to declare a variation as the winner), the more confident you can be about the test result.”

If you only get a 5% lift, then you need a confidence level of 95-99%. But if you get a 25-30% lift, you don’t need that high of a confidence level.
To get that kind of lift, you need a fundamental change on your website. That can include:
- A complete redesign of the page or site
- A complete change in the information architecture (moving from a five-step checkout to a single page, for example)
- Changing the actual offer
Yes, that’s more than a headline change. And to make a shift that big, you should rely on more than your gut and best practices. You need data from your customers as well.
Five data sources to create the fundamental change
We rely on five data sources to run our serial tests. They are a combination of customer data, keyword research, and our own best practices review. We use the tool Hotjar to generate the website-related customer data.
Keep in mind that even if you’ve collected the data, you still need insights from folks who are trained in conversion, user experience, keyword research, copywriting and design. They need to analyze the data and execute the recommendations.
Ok, so let’s take a look at the data sources and how they work.
Five Data Sources
- Hotjar heatmap results (quantitative)
- Hotjar form analysis (quantitative)
- Keywords (quantitative)
- Hotjar survey results (qualitative)
- 15-question review (qualitative)
The combination of these five data sources will help us determine:
What visitors do (quantitative)
And
Why they do it (qualitative)
To prioritize which pages should be tested, we will typically review the most heavily trafficked pages, or those that are critical to a transaction.
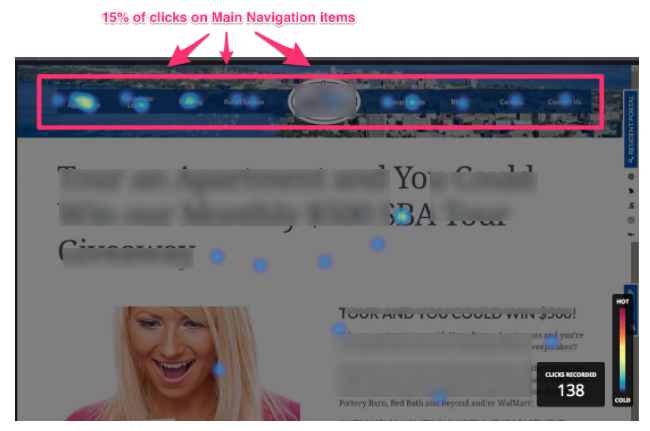
1. Hotjar Heatmaps (quantitative)
The three Hotjar heatmaps we use are:
- Click and Tap Heatmaps – Show where the visitors click their cursor on desktop devices and where visitors tap their finger on mobile and tablet devices.
- Move Heatmap – For desktop devices, reveals where visitors move their mouse.
- Scroll Heatmap – Shows which position on the page your visitors are scrolling to. Includes the exact percent of visitors that see a specific vertical position.
Heatmaps can also give us responses based on device.
After running a heatmap for a month, we conduct a Heatmap Quantitative Analysis. This is based on Hotjar’s 8 quick tests, which can give us simple actions to improve the site pages:
1. The Link Test – Are visitors clicking dead ends?
2. The Distraction Test – Are irrelevant elements distracting visitors?
3. The Information Test – Is there missing information on the page?
4. The Device Test – Does the page work on different screen sizes?
5. The Depth Test – Is all the content easily reachable?
6. The Engagement Test – What are the site visitors really looking for?
7. The Fold Test – Does the page have what it takes to keep visitors?
8. The Header Test – Is the page header helping or hurting the site?
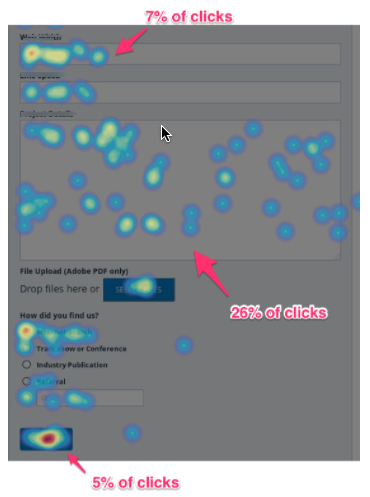
2. Hotjar Form Analysis (quantitative)
We use a Hotjar heatmap to test the form and determine why people might be abandoning it. It’s amazing to see what simple little errors can cause someone to abandon a form. Even confusion with filling in the name can cause someone to bail out.
3. Keyword Research (quantitative)
We review the current keywords the page is ranking for. The research may reveal keywords that you are ranking for that may not have shown up in your initial keyword research, but turn out to be a “buying” word or phrase customers are using in searches. We may decide to use these keywords more prominently in the messaging.
4. Hotjar Surveys and Polls (qualitative)
To get a quick understanding of why visitors are on the site, we’ll use an open-ended feedback poll or survey. The survey will be based on the particular page, and triggered by a particular customer action. If they exit the page, for example, a survey might appear, “Could you tell us why you are leaving?
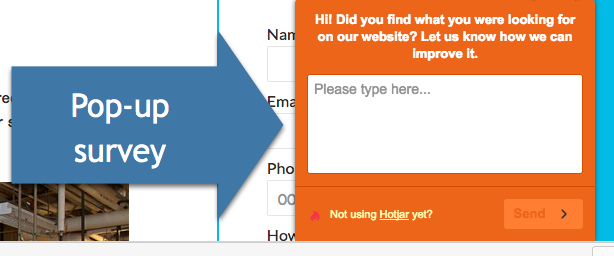
Were you able to find what you are looking for?”
5. 15-Question Review (qualitative)
The 15-question review is conducted after the other tests are finished. We draw from the heatmaps, surveys, and keyword research in creating the answers, which lead to suggested actions.
These 15 questions are drawn from this post from Andy Crestodina, which includes a number of tools we can use. We also draw from our own experience in best practices to answer these questions when we don’t have data-driven answers, especially if the site has a glaring mistake.
What’s going on in the life of this visitor?
Can visitors tell what you do at a glance?
Does this page answer the visitor’s top questions?
What is the best order for the information on the page?
Are the sections for headers meaningful? Are they helpful?
Is everything visible? Or is anything hidden behind a click?
Do 100% of visitors know the meaning of these words?
Is the content formatted for people that scan?
What do you want your visitors to do?
Did you add evidence to support your marketing claims?
Does the page have a call to action?
Did you miss a chance to be personal and human?
People looking for this page are searching for what phrase?
Did we miss any opportunities to use relevant phrases?
Would people on other pages on our site be interested in this page?
Next: Conduct Serial Test
Now that we’ve collected the data, we’re ready for recommendations. We compile all the proposed site changes into one document, which provides the blueprint for the fundamental change. Then we make the changes to the website page.

The testing period begins once the new page is live. We monitor the results for 4-6 weeks, comparing the conversions from the new page with the old page. We keep in mind variables like seasonality, and then compare results. Again, we’re looking for a lift of 25-30% or more.
You want to do more than just improve the conversion rate, however. You also want to improve your business. So it’s important that those new leads coming in improve in terms of both quantity and quality.
That’s a lot of work, so is it worth it? YES!
This approach has proven successful in the past, resulting in an aggregate lift of 75% for the pages we’ve tested. Definitely a step in the right direction, and a number that’s hard to argue with.
This type of data-driven approach is important, but our conversion specialist Kyle Akerman pointed out that in some cases, JFDI is required for conversion optimization. If you have a page that is just so horrible and needs a ton of fixes just to get close to best practices, JFDI (Just F—ing Do It).
That will only take you so far, however. At some point, when the hangover is real and that traffic seems to exit from your website, a more disciplined approach is required. Feel free to use our process to clear your head and drive your profits.
Find out how your content and conversion ranks with our interactive version of the Content Scorecard you can fill in yourself – no email required for download.